 |
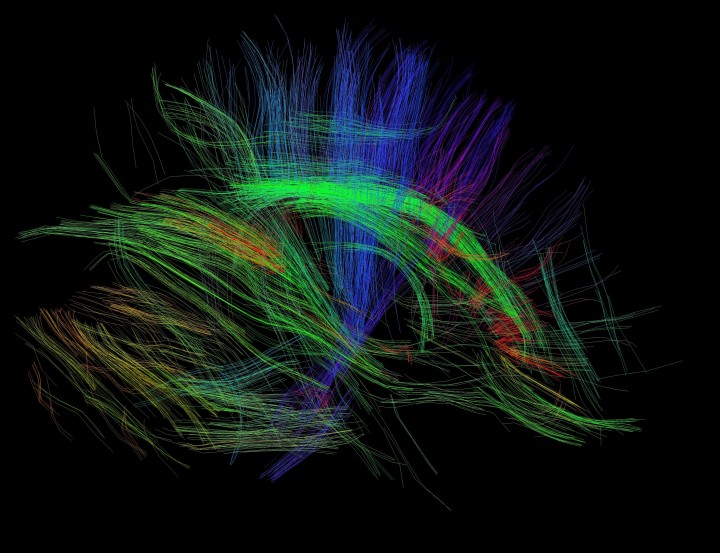
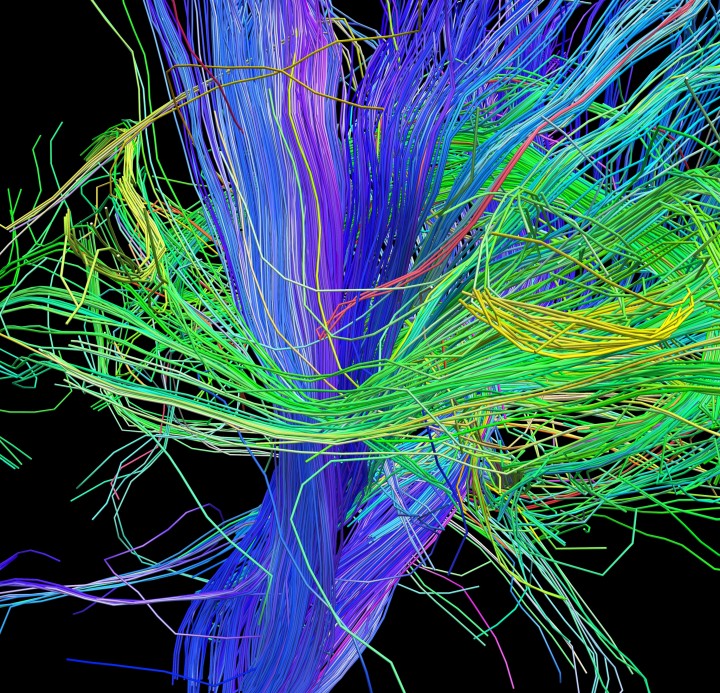
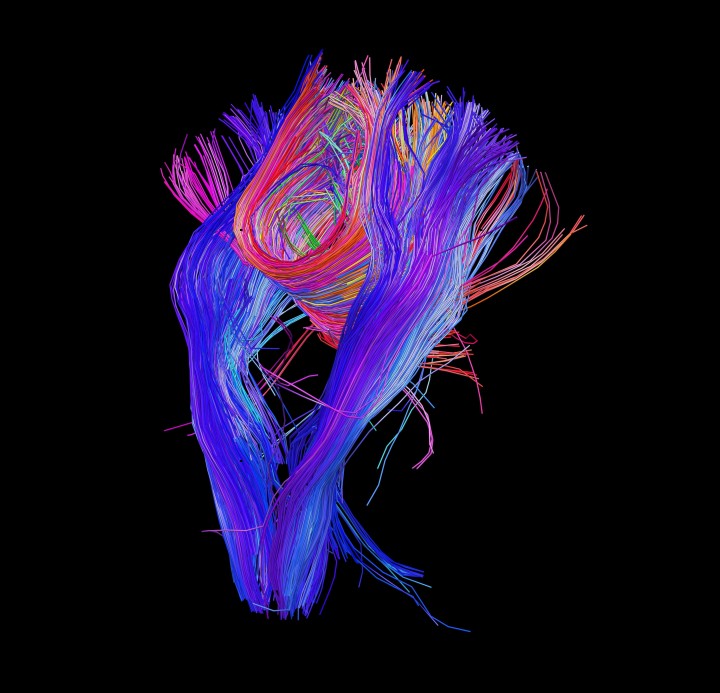
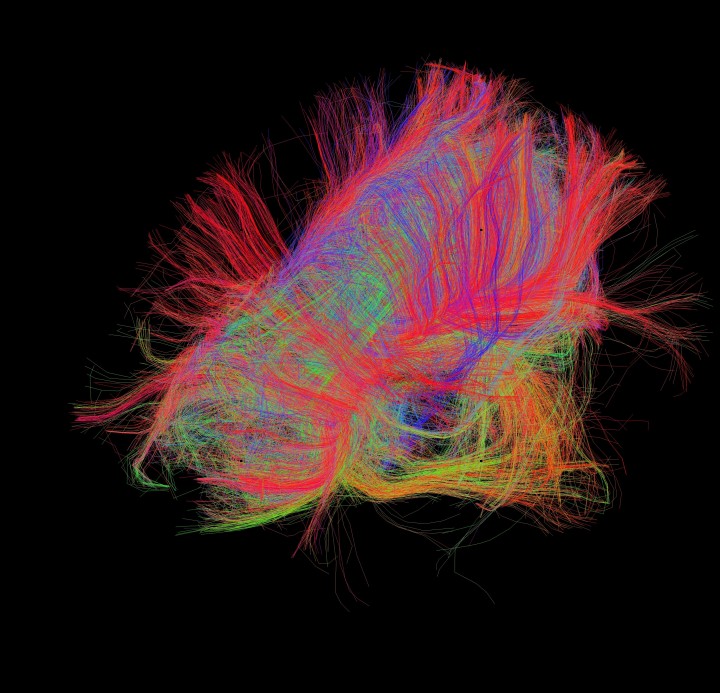
The Human Connectome Project (HCP) features brilliant images collected using Trackvis software and the Connectome 3T scanner. The HCP was featured in our post on the Top Neuroscience projects. In the images below, white matter fiber architecture of the brain. Measured from diffusion spectral imaging (DSI). The fibers are color-coded by direction: red = left-right, green = anterior-posterior, blue = through brain stem. Data provided by: Randy Buckner, PhD. Software: Trackvis. All Visualization by Vaughan Greer.  |
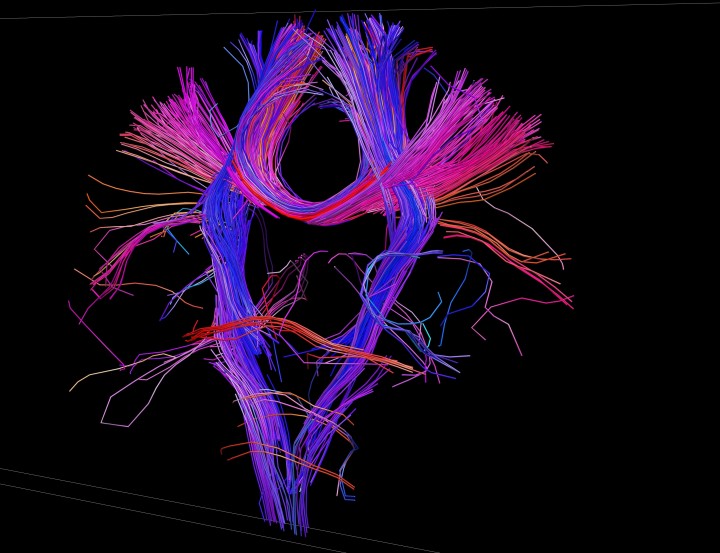
The Human Connectome Project


0 comments:
Post a Comment